The entry "Views" in the menu bar offers items to open windows containing different views of the geometric construction. Each view is a kind of "projection" of the abstract configuration to some visible part of the computer screen. Usually you can make constructions and manipulations in any of the views. The changes are reported to the other views immediately. In particular, you can have many views of the same type (for instance two Euclidean views with different scales).
The views are also related to the different kinds of geometries. Which view is appropriate for which geometry is discussed in the section "Views and geometries".
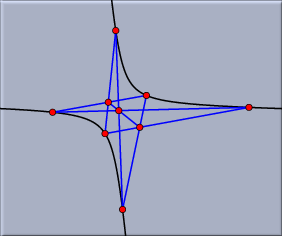
The Euclidean view is the usual drawing surface. When Cinderella is started you will get a window containing a Euclidean view. It is the natural window for doing Euclidean geometry.

|
| Pascal's Theorem in a Euclidean view |
The Euclidean view has view-specific control buttons. They can be used for zooming and translation. Furthermore they are used to control grids and snap points.
This mode allows the entire coordinate system to be translated After you have selected this mode you can move the view around while pressing the left mouse button.
With this mode you can zoom into the drawing. There are two ways of doing this:
With this mode you can zoom out the drawing. The operation is inverse to the zoom in operation. There are two ways of using this mode:
Shows/hides a grid on the view.
Shows/hides a coordinate system within the view.
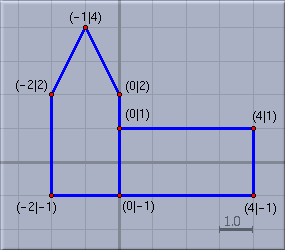
Toggles the "snap" mode. In this mode the grid points are magnetic and will attract the mouse. This is the ideal tool for exact drawings. If you first select this mode the grid and axes are automatically shown. You can hide them again individually.
Gives the grid a higher density.
Gives the grid a lower density.
|
| Using "Snap" for exact drawings |
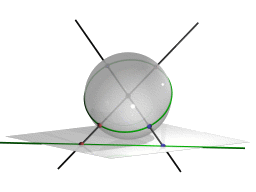
The spherical view arises from a projection of the Euclidean plane onto the surface of a ball. The center of the projection is the center of the sphere. The plane does not pass through this center.
|
| Projection from the plane onto the ball |
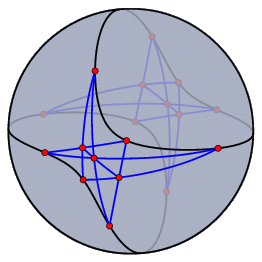
This projection maps each point to an antipodal pair of points on the sphere. Each line is mapped to a great circle (an equator) on the sphere. The incidence structure is preserved. Working with the spherical view allows elements at infinity to be manipulated. They lie on the boundary of the image of the unrotated sphere.
|
| Pascal's Theorem in a spherical view |
The spherical view is a natural way to represent elliptic geometry. Measurement of angles between lines corresponds to measuring angles on the sphere. Measuring distances corresponds to the usual geodesic measurement of distances on the sphere, while keeping in mind that antipodal points are identified with each other.
This mode allows the spherical ball to be rotated (after the projection). In this mode you can rotate the view by moving the mouse keeping the left button pressed.
This action resets the rotation of the spherical view to its original position. After a reset the visible boundary of the ball corresponds to the line at infinity again.
This slider lets you control the distance from the sphere to the Euclidean plane. You can use this slider to find the right magnification of the drawing.
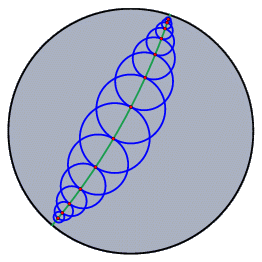
The hyperbolic view is the natural view for hyperbolic geometry. In fact doing hyperbolic geometry is the main reason for opening a hyperbolic view. The hyperbolic view represents an implementation of the Poincaré disc model of hyperbolic geometry. In this model the (finite part of the) hyperbolic plane is represented by a disc. Each line is represented by a circular arc that is orthogonal to the boundary of this disc. The measurement of angles between lines is conformal. This means that you can read off angles by measuring Euclidean angles between the circular arcs. The measurement of distances is such that the elements on the boundary are "infinitely far away" from any other point on the disc. If you "walk" in hyperbolic unit steps in one direction, you will never reach the boundary. In the disc the steps seem to become smaller and smaller (in Euclidean measurement).
 |
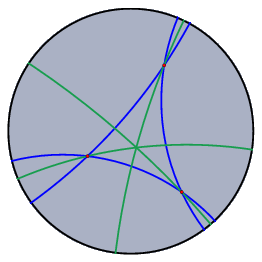 |
| Hyperbolic circles of equal size | Hyperbolic altitudes meet in a point |
Polarity is an important concept of projective geometry. Because of the complete symmetry between lines and points it is possible to turn every statement about incidences of points and lines into a corresponding "polar statement" where the role of points and lines are interchanged.
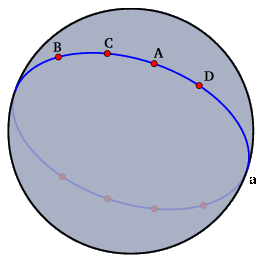
Cinderella offers two polar views for visualizing polarity. The polarity implemented in Cinderella is the polarity with respect to the identity matrix. In algebraic terms, we use the homogeneous coordinates of a point and interpret them as a line, and vice versa. Geometrically this finds its easiest interpretation in the spherical view. Whenever you have a point consider it as a "north pole"; the corresponding "equator" is its polar line. Whenever you have a line consider it as an "equator"; the corresponding "north pole" is its polar point. The figure below shows a configuration in the spherical view and in the polar spherical view.
 |
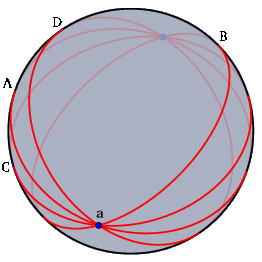 |
| A configuration ... | ... and its polar |
Polar view elements are selectable but moving them is disabled. If you want to move elements then you have to control them in a primal view.
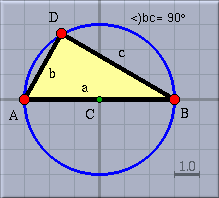
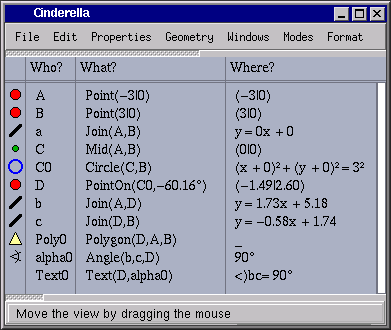
The Construction Text is a textual description of the construction steps. Each element of the geometric construction is represented by a row in the construction text window.
|
| A picture of Thales' Theorem |
Each row is shows a little icon that resembles the element it refers to. The icon is shown in the size, color and shape of the element. This makes it easy to identify elements quickly.
|
| The construction steps for Thales' Theorem |
The construction text consists of four columns. The first column shows the icons. The second column shows the labels of the geometric elements. These labels are unique identifiers within the construction. The third row explains how the element is defined. The fourth row represents the current value of the element. In most cases this is the present location with respect to the coordinate system. With the menu "Format" you can change how the locations or values of elements are shown.
The texts that appear in the "Construction Text" are exactly the three entries that can be referenced by the "Add text" mode.
The four columns are separated by vertical lines. You can pick these lines with the mouse to control the width of each column. If the text has too many rows for the window, a scrollbar at the right side of the window is available for scrolling.
In each view a tool bar at the bottom displays view-specific operations. The ones that are common in all views are described below.
If you press this button the contents of the view will be exported to a PostScript file. You will be asked whether you want to have the picture in color, gray or black and white. The file generated contains an initial section where you can adjust the appearance of the printout later. It starts with:
%%%%%%%%%%%%%%%%%%%%%%%%%%%%%%%%%%%%%%%%%%%%%%%%%
% Drawing mode:                                 %
% mode=0: color  /  mode=1: gray  /  mode=2: bw %
%%%%%%%%%%%%%%%%%%%%%%%%%%%%%%%%%%%%%%%%%%%%%%%%%
/mode 0 def
By changing the mode flag you can later on choose the color representation you want. It is also possible to change the background color.
%%%%%%%%%%%%%%%%%%%%%%%%%%%%%%%%%%%%%%%%%%%%%%%%%
% Background color  (default white)             %
%%%%%%%%%%%%%%%%%%%%%%%%%%%%%%%%%%%%%%%%%%%%%%%%%
/background { 1 1 1} def
The other settings in the PostScript file are more or less self-explanatory.
With these buttons you change the current geometry. All geometric constructions refer to this geometry. For a detailed discussion of geometries consult the chapters "Geometries" and "Behind the scenes".